I finally managed to make some experiments on my implementation of pso (available from here). I played a little with parameter on two different test:
-
Iteration test - program tries 20 runs with in 2 dimensional space on problems introduced in last article (here).
-
Dimension test - program tries 2 to 10 dimension on problems those three problems.
Some nice plots went from this experimenting and I want to share them with you.
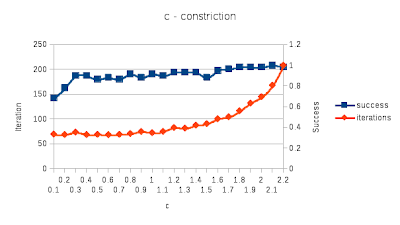
Constriction
This one show dependency of c on success and iterations. It was performed on Iteration test. We can see that success slightly rose but after some threshold iterations start to grow exponentially. I think this is because particles start to overshooting massively the optimum.
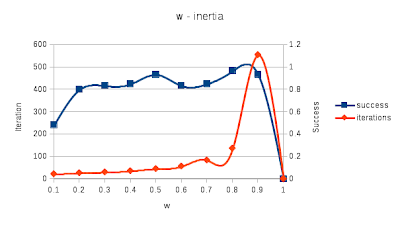
Inertia
Here we can see that recommended values of w between 0.4 and 0.9 are reasonable. With low inertia they fails in half cases. But as we can see of iterations we should choose rather smaller w, because of efficiency. Interesting is that with w = 1.0 everything always fail.
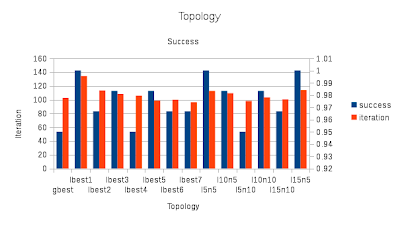
Topology
Here we can see which topologies are better than others. This experiment was also performed on Iteration test. Quite surprising is that gbest has rather lower success rate than others topologies. Also we can see that with more neighbours in lbest topology, number of iterations descends.
Dynamic topology is in format Ixny - where x is number of iterations between change and y is number of neighbours. It has great result in some cases.
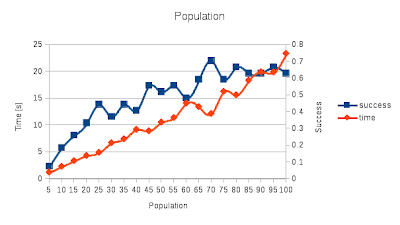
Population
Here I made experiment with population size to time and success. This one was performed on Dimension test, because I wanted to see if higher number of population size can get out of local optima even in higher dimensions. Results are expected with more particles in population the time grows but also success rate. You can see that time is better with higher success rate. It is because algorithm is restricted by 1000 iterations max so when it is unsuccessful it spends a lot time in local optima before its shutdown.